Recently, I had reason to try and check performance on a radio I had acquired, but I had neither a service monitor, nor a second radio like it available (I’m in the middle of a move, so it could have been packed, or been a dead battery issue… but I digress…).
The thought occurred to me that I could attenuate my transmitter’s signal by a known amount, and just use an SDR as a crude service monitor. When you come down to it, most SDR software packages read out some RF level (usually dBm), a host of demodulator options, and an RF spectrum display. Some even have windows for both the time- and frequency- domain audio waveforms. Given the ability to drop a cursor on a peak, and actually read details on the spectrum, this sounds like it’s more capable than my old Motorola 2200… at least from the receive side…
Choosing an attenuator was the next challenge. Most SDRs and test equipment can’t handle even a 4W transmitter directly on their input. Service monitors are the exception, as they’re designed for direct transmitter connection and termination. On top of all that, many adjustable attenuators and other components are not designed for higher power levels… and I wanted a scalable solution that would work for not only a 4W transmitter, but also a 100W transmitter, and maybe beyond.
At some point, the attenuation values will be selected in terms of dB, and the SDRs generally work in terms of dBm and dBuV (dB above a milliwatt, and dB above a microvolt, respectively). So to figure out the baseline transmitter output power in terms of dBm, there are several “known” values when it comes to converting Watts to dBm. With a little bit of an engineering mindset, the approximate dBm value can be determined –
- 1 mW = 0 dBm
- 10 mW = 10 dBm
- 100 mW = 20 dBm
- 1W = 30 dBm
- 10W = 40 dBm
- 100W = 50 dBm
Add to that some identities:
- Half the power = -3 dB
- Double the power = +3 dB
For example… If I start with what I expect to be a 4W transmitter…
- 1W = 30 dBm
- 30 dBm + 3dB = 33 dBm = 2W
- 33 dBm + 3dB = 36 dBm = 4W
OR (searching for something “close enough”
- 10W = 40 dBm
- 40 dBm – 3 dB = 37 dBm = 5W
And of course, one can always directly convert with a calculator:
The solution I arrived at, once I started digging through my RF components drawer was to use a 30 dB 100W attenuator to reduce transmitter power to what I call “instrumentation levels”; i.e., RF levels that might overload, but would not damage an SDR (or even spectrum analyzer). Generally speaking, I shoot for this first attenuator to get my transmitted signal down to the -10 dBm to +10 dBm level, preferring for it to be zero dBm or less, when possible.
The table below shows some typical power levels, and the dBm equivalents when attenuated by common values – this helps serve as a selection guide for the high power attenuator. The acceptable levels are shown in bold, and the levels that are too high for typical instrumentation are italicized because, well, i couldn’t get wordpress to allow different colors in different cells.
Note that it is the user’s responsibility to ensure proper power handling capabilities of attenuators and downstream equipment!
| Power (W) | 5W | 10W | 25W | 50W | 100W | 1000W |
|---|---|---|---|---|---|---|
| Power (dBm) | 37 | 40 | 44 | 47 | 50 | 60 |
| Reduced by 10dB | 27 | 30 | 34 | 37 | 40 | 50 |
| Reduced by 20dB | 17 | 20 | 24 | 27 | 30 | 40 |
| Reduced by 30dB | 7 | 10 | 14 | 17 | 20 | 30 |
| Reduced by 40dB | -3 | 0 | 4 | 7 | 10 | 20 |
| Reduced by 50dB | -13 | -10 | -6 | -3 | 0 | 10 |
| Reduced by 60dB | -23 | -20 | -16 | -13 | -10 | 0 |
In my case, the transmitter was supposed to be a nominal 4W (we all know what the actual transmitter was…)… so 36 dBm – 30 dB = 6 dBm (or 4 mW).
A note here – attenuators and amplifiers operate in terms of dB… not dBm or dBuV. A 30 dB attenuator will reduce both power levels by 30 dB and voltages by 30 dB. Those components are RELATIVE, not absolute. A dBm rating would likely only be for max power or voltage handling capabilities (for example, my attenuator is only capable of 50 dBm, max).
Back to my setup… 6 dBm is pretty high when it comes to feeding instrumentation, so this needed to be resolved. In this case, it looked like I could put a second attenuator in series – I didn’t have another adequately sized fixed attenuator (3 dB just didn’t get me below zero), so I put in an adjustable step attenuator, and set it for 6 dB.
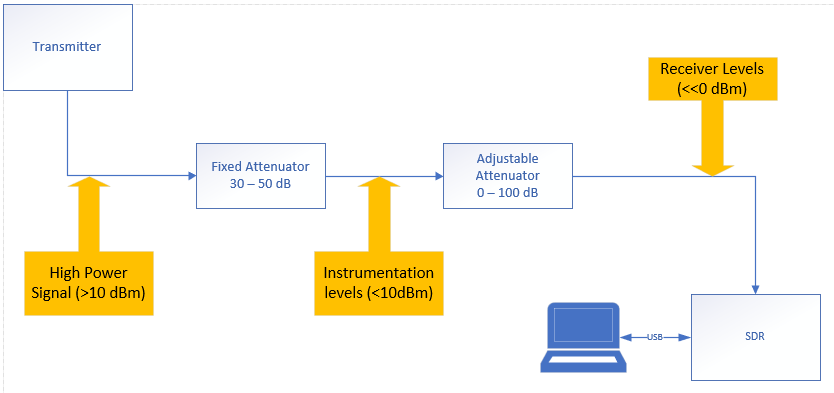
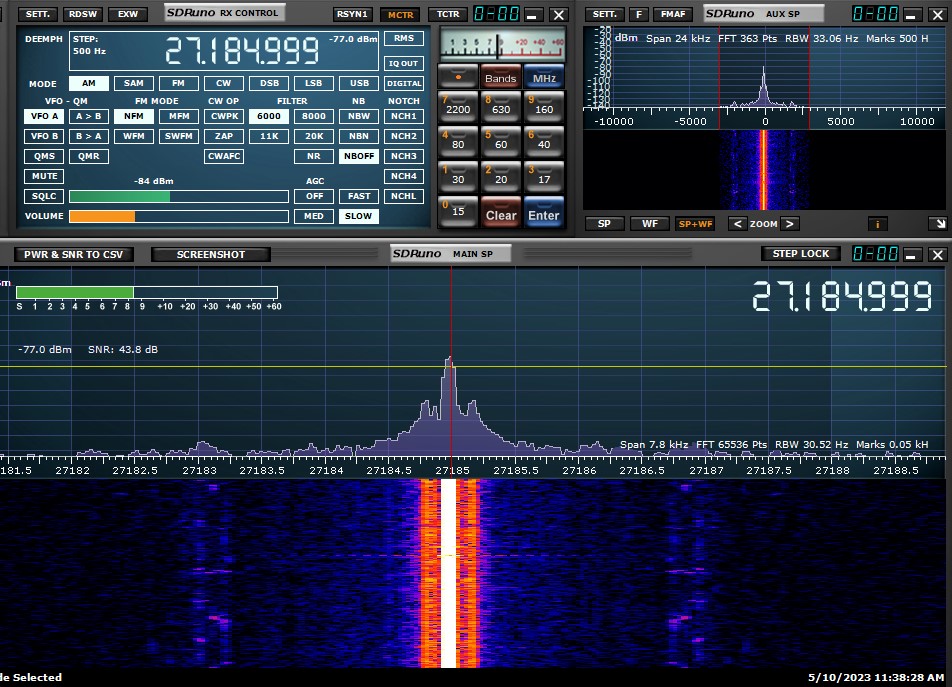
I keyed down the radio, and, as expected, I got a spectrum display, but the receiver still reported an overload condition. Fortunately, the step attenuator I had has 20/20/20/20/10/5/3/2/1 dB steps that can be individually switched in or out. I started increasing attenuation until I got a better display that I felt was accurate – once I got a total of 110 dB in (fixed high power 30 and four 20 dB steps), I could switch a 10 dB step in and out and see the received carrier increase and decrease by 10 dB on the spectrum display.
From that point, I looked at my received carrier level of -77 dBm and corrected for my attenuation level, and determined my peak carrier level to be 34 dBm (-77 dBm + 110 dB = 33 dBm). This corresponds to a carrier power of 2W, which probably isn’t far off, as it agrees almost exactly with my old uncalibrated NOS micronta 3 meter tester. In the image below, the carrier level is displayed next to the upper frequency display… yes I’m off by 1 Hz. Close enough.
One final note on the receive side is that the SDR you use directly affects your results. An RTL-SDR is really cheap, BUT they’re designed for 75 ohms (typically) which will affect your accuracy, and I don’t know how consistent the cheap ones are. Something like an RTL-SDR.com version might be higher quality, and yield better results, but for the money, an SDRPlay or Pluto might give a more accurate result.
Now, this is not to say that the setup provided here is the only way to achieve this. An RF directional coupler would be a good option and allow for the RF to be terminated into an antenna or external dummy load. The issue here is that directional couplers are generally frequency band specific, so you need the correct coupler for your application, where attenuators are generally more broadband (and also less expensive). Directional couplers also typically have coupling factors in the 6-50 dB range (depending on the model), so additional attenuation will be required to keep from overloading the receiver.
Software is another gotchya. As I mentioned BEFORE, there are other applications like SATSAGEN which add more functionality, like full duplex operation (if your SDR or SDRs support the functions), which can be a huge benefit for repeaters or other unique setups. One note – I tried Satsagen for this test, and it wouldn’t report the amplitude units form the RSP1A correctly, though I have used it with an RTL-SDR in the past.
Once we’ve tested and aligned our transmitter… receiver time. An RSP-1A or RTL-SDR has no inherent transmit capability, so a different device is required, and the correct software. I don’t think software like SATSAGEN is capable enough to determine SINAD, and I certainly don’t see options on it for SINAD. It does provide 2 tone modulation, FM, AM, CW, ASK, FSK, and an external input. I probably need to read a manual for more than just FM and AM – but for what I was doing, it worked fine.
On a whim, I set up the RSP1A with SDRUno and the HackRF on Satsagen, cabled between them, and set them to the same frequency to see what I could learn. There is a ~1.8 kHz difference in frequency, which I attribute to my knockoff HackRF more than anything else. This is easily corrected, if I use my RSP1A as a reference receiver, and use the “More Settings” menu in Satsagen, once I accounted for the offset, they matched just fine.
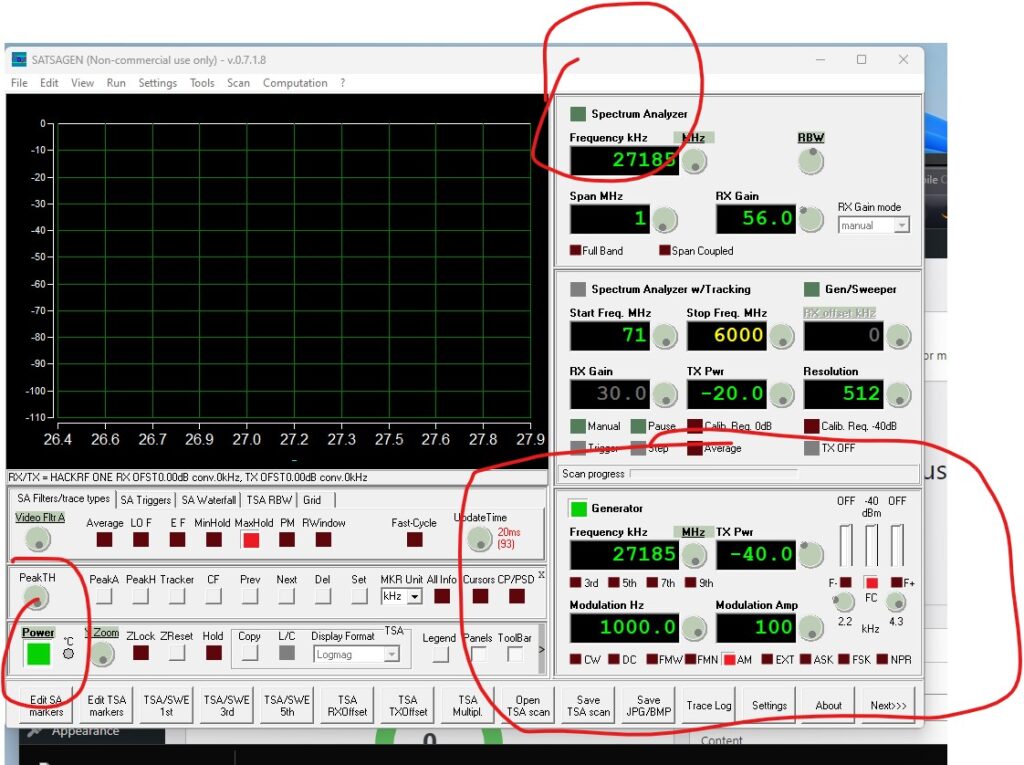
Once I got it dialed in on frequency, I connected the HackRF output to the attenuation system I used for the receive tests, and monitored my radio output for audible modulation (I set it up for a 1 kHz AM tone), and increased attenuation until I could no longer hear the tone. It turned out that 30 dB plus an additional 55 dB resulted in a barely discernable tone. With my HackRF output set to -40 dBm, this resulted in: (-40dBm + -30dB + -55dB = -125 dBm) as my approximate sensitivity. I’d go closer to -120 dBm as a realistic sensitivity level. This would end up being (-13 dBuV), for those tracking voltage levels (dBuV = dBm+107). It is notable that I left the high power 30 dB attenuator in place (while the high power path is usually directional, for instrumentation level signals, they will provide the same attenuation in the reverse direction). This high power attenuator facing the transceiver ensures that if I accidentally keyed the radio for any reason, the HackRF would be protected from high power at the front end.
The image below shows the Satsagen window – and the fact that the main power is on, analyzer off, and generator on. One can also observe the modulation settings and frequency/power levels. It’s interesting that the generator CAN turn modulation sidebands on, additional tones on, and turn the carrier OFF. This might be useful for testing sideband radios in a pinch.
I suppose that if I were to use my Digilent Analog Explorer as an input, and maybe even a generator, I could probably determine SINAD, but that was really way beyond what I wanted to achieve at this time. Maybe at a future date….
Now – closing remarks.
Yes, all of these checkouts could also be done over the air with a small stub antenna in the shack, but then you give up any hope of a controlled signal level. You also radiate unintentional noise which could interfere with others nearby. A closed circuit environment is always preferred when attempting to determine if a system is even operating qualitatively, let along quantitatively.
Let’s not kid ourselves. This would NOT fly for a commercial 2 way radio shop. The service monitors used in those facilities are calibrated using NIST traceable sources and procedures. The equipment is calibrated on a scheduled basis. Half of the service monitors out there now even have P25 and DMR modulation / demodulation.
A new commercial service monitor may even be an SDR under the hood, but there’s a reason they cost more than the combined lot of my radio gear. The accuracy and repeatability is guaranteed to within a few PPM and likely 0.01dB or less, whereas with the hobby grade SDR, if it’s repeatable, you got lucky, and i wouldn’t bank on even 0.1 dB being correct. This approach will suffice to verify a system is CLOSE to on-frequency, and that a system output is “clean” to an extent… or that a receiver is operating properly… so it’s a hobby grade tool, at best.
(Edit, 3/14/2024)
There has been some other work done to measure deviation in a more precise method than channel width observation, note… this is not my work, but is relevant.
https://www.qsl.net/kp4md/freqdev.htm (and a video)
I’ve seen posts about people asking to do something similar using a BladeRF, but haven’t seen actual work on such a project – only questions about it.
(Edit, 1/25/2025)
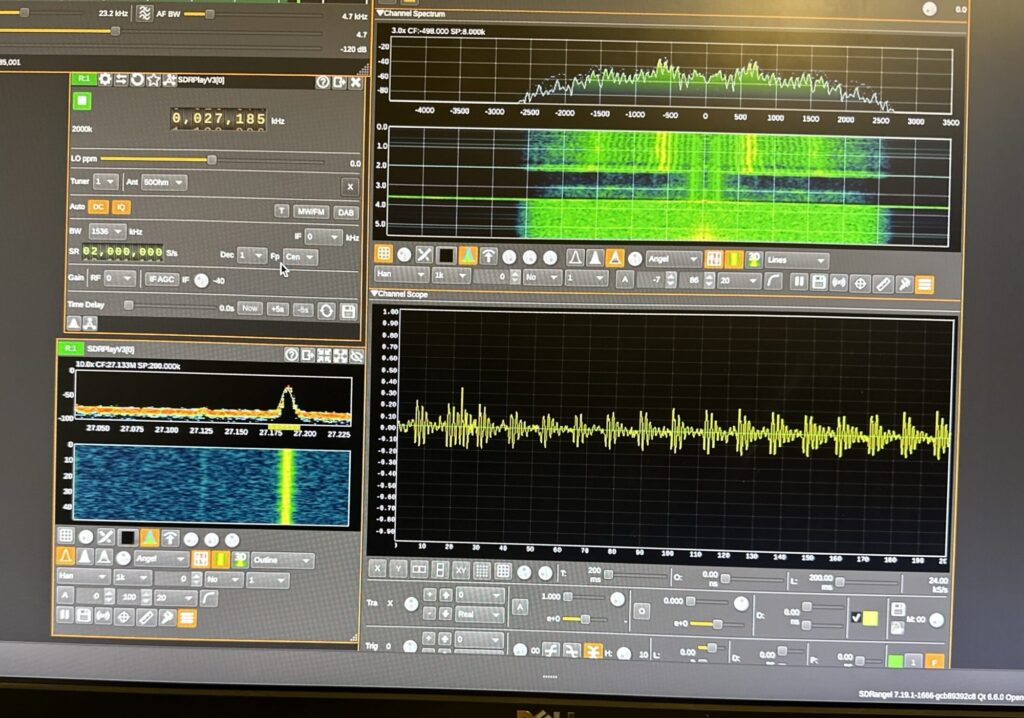
So, just a bit more info… I downloaded SDRAngel – which has some really cool features… Specifically the demodulation windows – with the AM and FM demodulators, it not only shows spectral content, but also the time domain waveforms. With a little tweaking (and accounting for the attenuation), this also has the ability to act as something of a poor-man’s service monitor. I believe it can also handle some transmit features… it’s just been a while since I fired it up and played with it.
